Sources;
Third Quarter Lessons
- Spreadsheets for Data Analysis
- Functions and Formula
- Cell Reference
- Logical Operation (AND, OR and NOT)
- IF
- Conditional Formatting
- Charts
- Macros
 |
| Macros ( in real life ) |
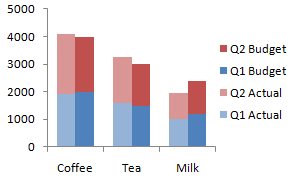 |
| Column Chart |
 |
| Pie Chart |
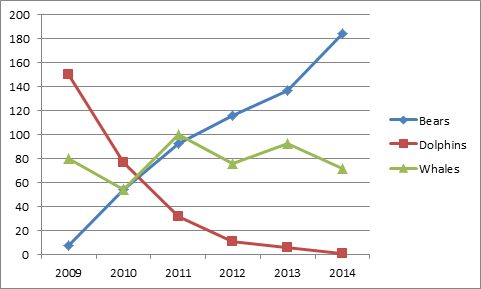 |
| Line Chart |
 |
| Bar Chart |
 |
| Conditional Formatting |

 |
| Table |
 |
| Cell Reference |
 |
| Pythagorean Theorem |
 |
| http://i.msdn.microsoft.com/ |
| http://www.etektraining.com/ |