Saturday, March 14, 2015

Data Representation

"There are 10 types of data stored in a Computer."

Actually, there are only 2, 1&0. A computer can only understand 1 and 0 as its data and even the data you input are made up of 1 and 0. the computer decodes algorithms of 1 and 0 and the result is what you are seeing now. But how does the computer decode these algorithms?

These are called Binary Data. There are two types of data stored, Original Data and Previously Stored Data. Original Data is data being introduced to the computer system for the first time while Previously Stored Data has already been processed and is being stored for Future Use.

There are three common basic technologies for storing Binary Data

  • Optical (Compact Disc)
  • Magnetic (Hard Disk)
  • Electronic (Flash Drive)
Binary Data consists of the basic unit of measurement when it comes to computers, Bit. Bit can represent two states of information such as Yes or No. Next to Bits are Bytes which consist of 8 Bits. If a Bit can represent two sates of information, then a Byte can represent 254 more states.

But how is information moved inside a computer? Easy, data is moved about in bytes or multiple bytes called Words. The number may vary per computer. If your computer is 64 bit, then the bits  per word is 64. The same happens if it is 32 bit.

Friday, March 13, 2015

Software

Now, we are to discuss the more important part of a computer system, the software.

Software refers to any program that tells the computer what to do. You can't produce outputs without the software to keep the memory. Now the more important question; can hardware work without software? It can, but not much activity.

There are different types of software, the System and the Application software. The System Software are programs that take control of the PC on startup, and then play a central role in everything that happens within a computer system by managing, maintaining, and controlling computer resources.

The System Software may include the OS, Compilers, and Platforms.

OS or Operating System monitors and controls  all input/output and processing activities within a computer system.It is the overall controller of the Software.Examples are Windows, Dos, Ubuntu, etc. Compilers are softwares used to create softwares through Programmng, The GCC and the JAVAC are examples of compilers.

 How about platforms? Platforms are defined as a combination of a processor and an operating system. Before choosing a platform, one must consider

  • availability of appropriate commercial applications for the platforms
  • compatibility of platform with existing hardware, software, and expertise.
The Application Software takes control of softwares for personal use like MS Office, Video Downloaders, and Games :D

Computer System + Hardware Specs

Getting a Computer is easy. The problem is you don't know how it works. Worse, you probably not find it in your standards, which means you've got the wrong computer. This blog will teach you how to prevent these future problems.

Computer Processing
A computer system is one that is able to take a set of inputs, process them to create a set of outputs. This is done by a combination of hardware and software. Yes, only hardware and software. So if you take away either the hardware or the software, what you have there is not a computer system. It what makes a computer a computer.


A Gaming Laptop
Now what if you want a computer for your own standards? You have to consider the Hardware Specs (short for Hardware Specifications). Hardware Specs dictate the limits and maximum capability of a hardware device depending on a given unit of measurement. For example, if you want to buy a laptop for gaming, you need to consider that the hardware specs of the unit you are going to buy should be very high like the memory, graphics and sound card, etc. And if you want to buy a laptop for office use only, you don't need to buy a high-end type because it would be a waste of money.

Sunday, January 18, 2015

Conclusion

To end my 3rd Quarter blog, I've learned many lessons that can be beneficial in my use of Microsoft Excel. This proves that everything that I learned can and will be useful for future purposes. These may also make working in Microsoft Excel  more productive and more efficient.

Sources;

Third Quarter Lessons
  1. Spreadsheets for Data Analysis
  2. Functions and Formula
  3. Cell Reference
  4. Logical Operation (AND, OR and NOT)
  5. IF
  6. Conditional Formatting
  7. Charts
  8. Macros

Macros

Imagine you are to present your lesson to 10 different sections simultaneously. Hard, right? In these kinds of situations, you can make duplicates of your lesson and present it to the classes in order for you not to do the same thing over and over again if you want the shortcut. But if you want the long run, suit yourself. We can do these kinds of shortcuts in Microsoft Excel with the help of Macros.

Macros ( in real life )
One of the more powerful, but seldom used function in Microsoft Excel, Macros are shortcuts that can be used, are efficient and provide an ideal way of making repetitive tasks many times without writing a single line of code.


In order to do this, you must:
  1. Open Developer options in the Ribbon
  2. Click Record Macros
  3. Name the macro and the shortcut key
  4. Once the Macro is recording, do the things that you want the macro to record.
  5. Press the Blue box located in the lower left corner of your workbook once you are done.
  6. Press the assigned key for that macro to activate.
  7. i

Data Representation using Charts

In MS Excel, you have a lot of tools for you to improve your work at your discretion. One of these tools is Graphs/Charts.
Column Chart

We have certain types of graphs to use. These are:

  • Column Charts
    • useful for showing data changes over a period of time


Pie Chart

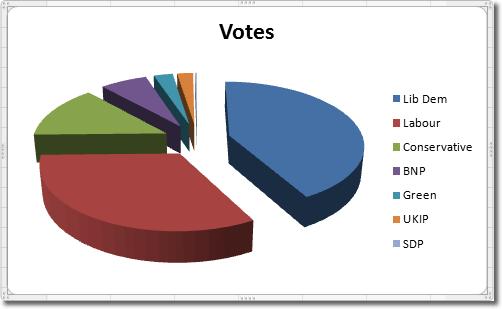
  • Pie Charts
    • show the size of items on one data series, proportional to the sum of items

Line Chart


  • Line Charts
    • display continuous data overtime, set against a common scale, and are therefore, ideal for showing trends in data at equal intervals.

Bar Chart


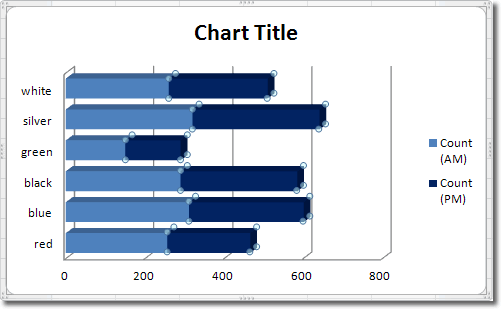
  • Bar Charts
    • illustrate comparisons among individual items
    • When to Use:
      • the axis labels are long
      • the values that are shown are durations.


And there are plenty more charts such as:
  •  Stock Chart
  • Area chart
  • Doughnut Chart
  • Bubble Chart
  • Radar Chart
  • Surface Chart and
  • Scatter Chart


Conditional Formatting

From the lesson about IF, we can know more about making conditions in a more advanced manner through Conditional Formatting.

Conditional Formatting
Conditional Formatting is applying unique cell formatting based on a certain condition. In Conditional Formatting you can apply the following

  • Highlight Rules
  • Top-Bottom Rules
  • Data Bars XD
  • Color Scales
  • Icon Sets, and of course
  • Customizing your own rule.

PS: When adding a new rule, add a formula that contains a condition and add new formatting.
Ex: =A1="PASSED"